Published On Oct 8, 2019
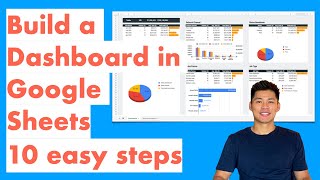
This is a Google Data Studio tutorial for beginners. We describe the most important Data Studio functions for you to build great Google dashboards.
🎁 Get your personal copy of the recruitment dashboard practice sheet: http://l.rw.rw/trydatastudio
🔌Start using Coupler.io to streamline your data flows: https://bit.ly/3cxpgXJ
🔹Visit Coupler.io for more details: https://bit.ly/3czPf0F
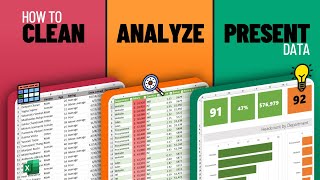
Data Studio provides you with an opportunity to pull data from various sources (such as Google Sheets, Google Analytics, Google Ads, BigQuery, MySQL, Youtube Analytics and many others). You can then easily build tables, charts, and apply various filters to modify your reports.
We review the whole flow from the basic account setup to building various Data Studio charts and dashboards. Use these timestamps to move right to a specific topic:
1:46 - Data Studio environment setup
2:14 - Data Source - Connector - Report or Explorer
5:19 - Connect a data source to a report
5:41 - Dimensions and metrics
6:55 - Data Studio report structure
8:29 - Tables and aggregational functions
15:44 - Filters and date ranges
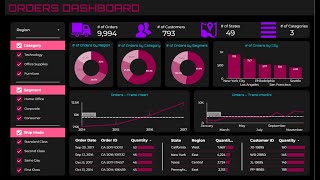
21:01 - Geo map (zoom area), scorecards, treemap, stacked bar chart, line chart
26:31 - Additional functions
✅ Subscribe to Railsware and learn the most efficient product management tools with us!
💌 Contact Railsware to build your software product http://bit.ly/contactrailsware
🤝 Join Railsware team http://bit.ly/railswarecareers
Design: Vlad Shagov
Video production: Vlad Shagov, Anastasiia Avramenko
Cases and speaker: Sergey Korolev