Published On Feb 20, 2023
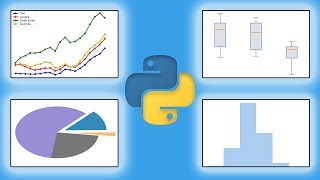
In this tutorial, we are going to learn how to use python to analyze numeric variables. We will create histogram and KDE plot for a certain numeric variable.
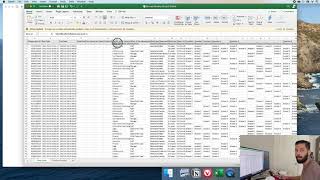
The dataset we use in this tutorial can be downloaded in here: https://drive.google.com/file/d/15li7...
Support me to make more videos: https://www.paypal.me/jessicasheng?lo...
show more