Published On Jun 3, 2018
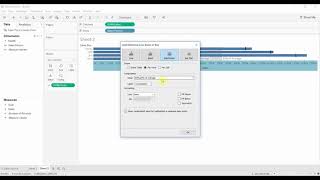
In this video we show you how to use Tableau to create bins and a histogram. Histograms help you see the distribution of records with regard to a measure by breaking them into buckets and creating a bar chart of the number of records that fall within each bucket.
You can download the workbook here:
https://tabsoft.co/2LLvuHn
The data will be available soon!
show more