Published On Dec 1, 2019
The yield curve was once just a wonky graph for academics and policymakers. But in recent years it has become a way to forecast looming recessions. The curve has helped predict every recession over the past 50 years. That means the curve accurately predicted even largely unforeseen downturns like the dot-com bubble of 2001 and the Great Recession in 2007.
As a result, news of yield curve inversions can now send markets tumbling. Policymakers keep a close eye on even small changes in the curve’s composition.
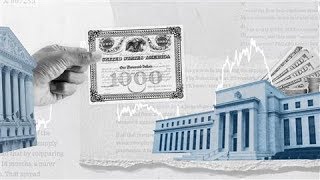
So how did this simple graph showing U.S. Treasury bond interest rates grow into one of the most reliable recession indicators we have? And what does a yield curve inversion really mean?
» Subscribe to CNBC: https://cnb.cx/SubscribeCNBC
» Subscribe to CNBC TV: https://cnb.cx/SubscribeCNBCtelevision
» Subscribe to CNBC Classic: https://cnb.cx/SubscribeCNBCclassic
About CNBC: From 'Wall Street' to 'Main Street' to award winning original documentaries and Reality TV series, CNBC has you covered. Experience special sneak peeks of your favorite shows, exclusive video and more.
Connect with CNBC News Online
Get the latest news: https://www.cnbc.com/
Follow CNBC on LinkedIn: https://cnb.cx/LinkedInCNBC
Follow CNBC News on Facebook: https://cnb.cx/LikeCNBC
Follow CNBC News on Twitter: https://cnb.cx/FollowCNBC
Follow CNBC News on Instagram: https://cnb.cx/InstagramCNBC
#CNBC
How The Yield Curve Predicted Every Recession For The Past 50 Years