Published On Jun 2, 2018
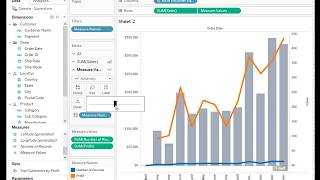
In this video, we show you how to create a combined axis chart. A combined axis chart has multiple measures on one axis, using the same scale. A DUAL axis chart has two measures on the same axis, but using different scales. A combined axis chart is one of the things you'll need to know as you go for your Tableau Qualified Associate certification.
Workbook and data are coming soon!
The data is coming soon!
show more