Published On Apr 21, 2024
The P-value is used for hypothesis testing to determine whether or not a difference between an observed result and the status quo is due to chance. When the p-value is being calculated, it is initially assumed that there is no TRUE difference between the status quo and the observation. This is what we call the null hypothesis.
A result is said to be statistically significant, or in other words not due to chance, if the null-hypothesis can be rejected. The null hypothesis can only be rejected if the p-value is less than or equal to the significance level. Therefore, the significance level is decided before the data is collected. The significance level is usually set as 5% but can also be set as 1% or even 10%.
The p-value for a normal distribution can be determined by calculating the z-score for a given event using the formula: z-score = (sample mean - mean of null hypothesis) / (sample standard deviation / square root of sample size). Then a z-score table can be used to find the associated probability of the event. Finally, we compare this probability to the significance level to determine if the null hypothesis can be rejected. Let’s use an example to demonstrate this in greater detail.
The average weight of all residents in a small town is 85 kg. A nutritionist believes that the true mean is different. She measured the weight of 36 individuals and found that the mean was 87 kg with a standard deviation of 6 kg. At a 95% confidence interval is there enough evidence to discard the null hypothesis?
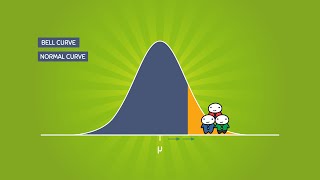
In this case the null hypothesis would state that the true mean is 85 kg while the alternative hypothesis states that the true mean is 87 kg. As the sample size is 36 and since it is more than 30 we can use the z-test instead of the t-test. In this case, as we are dealing with a normal distribution, the confidence interval or c is the area in the middle of the curve. Therefore, the significance level or alpha exists in equal proportions on both sides of the curve. Therefore, the position of the z-score has to fall outside of this confidence interval in order for us to reject the null hypothesis. In other words, the probability associated with the z-score has to be less than 2.5% or more than 97.5%.
Now, let’s plug in the numbers into our formula and simplify. This gives us a z-score of 2.0. If we now pull up a z-score table we find that he probability associated with 2.0 is 97.725%. Remember, this shows us the area of the normal distribution to the LEFT of the z-score, meaning that it includes all of this. This is SLIGHTLY more than 97.5%, meaning that we can reject the null hypothesis. In other words, the true mean of the weight in this town is 87 kg and not 85 kg.