
Published On Feb 26, 2023
AD: Sign up to enroll for a 7-day free trial with Coursera now! https://imp.i384100.net/c/4021125/134...
Learn all the fundamentals of Data Analysis on Excel in 10 minutes!
🆓 DOWNLOAD Free Excel file for this video: https://view.flodesk.com/pages/63f8ab...
#coursera #courserapartner @coursera
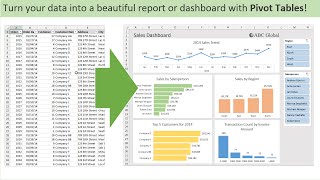
This video will teach you all the fundamentals of data analysis in just 10 minutes. First, we'll go over how to transform or clean up a raw set of data on Excel. This will include using features like the trim formula, data types, removing duplicates, and more. Then, we'll look at descriptive statistics using the data analysis feature on Excel. This will give us important numbers like the average, min, max, quartiles etc. We'll also create a box and whisker chart for analysing outliers. Third, we'll analyze the data using pivot tables. Finally, we'll create a small report using conditional formatting, xlookups, sumifs and more.
LEARN:
📈 The Complete Finance & Valuation Course: https://www.careerprinciples.com/cour...
👉 Excel for Business & Finance Course: https://www.careerprinciples.com/cour...
🚀 All our courses: https://www.careerprinciples.com/courses
SOCIALS:
🎬 My Company YouTube Channel: / @careerprinciples
📸 Instagram - https://www.instagram.com/careerprinc...
🤳 TikTok - / career_principles
🧑💻 LinkedIn - / careerprinciples
▬▬▬▬▬▬▬▬▬▬▬▬▬▬▬▬▬▬▬▬▬▬▬▬▬▬▬▬▬▬▬▬▬▬▬▬▬▬▬▬
Chapters:
0:00 - Intro
0:30 - Transforming Data
4:41 - Descriptive Statistics
8:10 - Data Analysis
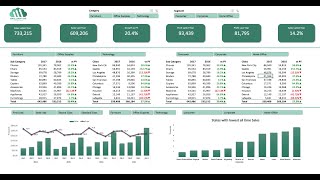
10:43 - Dashboard for showing your findings
Disclaimer: I may receive a small commission on some of the links provided at no extra cost to you.