Published On May 25, 2018
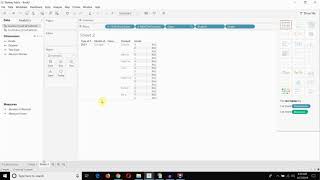
Tableau uses hierarchies when one measure is a subset of another measure. Hierarchies can be expanded and collapsed using plus and minus signs - much like dates - which adds an additional level of interactivity and flexibility to your dashboards. Aside from dates, they're great for drilling down into geography (Eg. Country, State, City) or into people or corporate structures (for example Sales VP, Sales Leader, Salesperson).
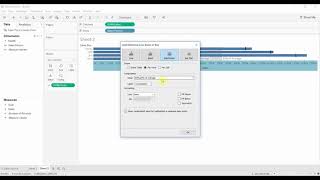
In this video we walk you through how to create a hierarchy and how they behave when they're used in a visualization.
You can download the workbook here:
https://tabsoft.co/2s0dOiQ
The data is coming soon.
show more