
Published On Apr 24, 2020
► Part of the DevOps Bootcamp 🚀 More infos here: https://bit.ly/41Wc1cM
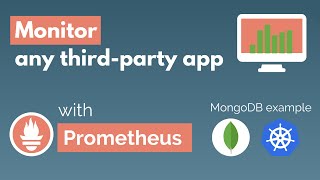
Fully understand how Prometheus Monitoring works | Explaining Prometheus Architecture | What is Prometheus Monitoring | Prometheus Monitoring Tutorial
Demo Part 1: Setup Prometheus Monitoring and Grafana on Kubernetes using Prometheus Operator ► • Setup Prometheus Monitoring on Kubern...
Demo Part 2: In the 2nd part we will actually configure Prometheus to expose /metrics endpoint and configure Prometheus to scrape it. ► • Prometheus Monitoring - Steps to moni... 🤓
Prometheus has become the mainstream monitoring tool of choice in container and microservice world. 🔥
In this video you will learn:
1) Why Prometheus is so important in such infrastructure and what are some specific use cases
2) How Prometheus works? What are targets and metrics?
3) How does Prometheus collect those metrics from its targets?
4) Furthermore, I explain Prometheus Architecture with simple diagrams and animations and go through the main components: Prometheus Server, Pushgateway, Alertmanager
5) The advantages of Prometheus Pull System compared to alternative monitoring tools, which use Push System
6) Using Prometheus Monitoring with Docker and Kubernetes
You will also understand better why it’s important to monitor your applications/infrastructure in general.
▬▬▬▬▬▬ T I M E S T A M P S ⏰ ▬▬▬▬▬▬
0:00 - Intro
0:31 - What is Prometheus?
1:06 - Where and why is Prometheus used?
2:21 - Specific Use Cases for using Prometheus Monitoring
5:57 - How does Prometheus work? Prometheus Architecture explained
6:04 - Prometheus Server
7:02 - Targets and Metrics
7:53 - Metrics
8:50 - How does Prometheus collect those metrics from targets?
9:21 - Target Endpoints and Exporters
11:12 - Monitoring your own application
12:03 - Pull Mechanism - Unique advantage of Prometheus
13:38 - Pushgateway for short-lived jobs
14:14 - Configuring Prometheus - Example YAML Configuration
16:20 - Alert Manager - Triggering alerts
16:55 - Prometheus Data Storage - Where does Prometheus store the data?
17:38 - PromQL Query Language
18:37 - My Experience
19:23 - Key Characteristics - advantages and disadvantages of Prometheus
20:40 - Prometheus Monitoring with Docker and Kubernetes
▬▬▬▬▬▬ Useful Links 🛠 ▬▬▬▬▬▬
Official Prometheus Exporters List ► https://prometheus.io/docs/instrument...
Prometheus Client Libraries ► https://prometheus.io/docs/instrument...
Photo source for Metrics Example: https://itnext.io/prometheus-for-begi...
#prometheus #prometheusmonitoring #devops #techworldwithnana
▬▬▬▬▬▬ Want to learn more? 🚀 ▬▬▬▬▬▬
Full Kubernetes and Docker tutorial ► https://bit.ly/2YGeRp9
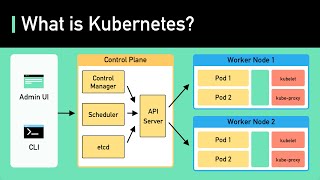
What is Kubernetes? ► • What is Kubernetes | Kubernetes expla...
Complete Jenkins Pipeline Tutorial ► • Complete Jenkins Pipeline Tutorial | ...
▬▬▬▬▬▬ Courses & Bootcamp & Ebooks 🚀 ▬▬▬▬▬▬
► Become a DevOps Engineer - full educational program 👉🏼 https://bit.ly/45mXaer
► High-Quality and Hands-On Courses 👉🏼 https://bit.ly/3BNS8Kv
► Kubernetes 101 - compact and easy-to-read ebook bundle 👉🏼 https://bit.ly/3Ozl28x
▬▬▬▬▬▬ Connect with me 👋 ▬▬▬▬▬▬
Join private Facebook group ► https://bit.ly/32UVSZP
DEV ► https://bit.ly/3h2fqiO
INSTAGRAM ► https://bit.ly/2F3LXYJ
TWITTER ► https://bit.ly/3i54PUB
LINKEDIN ► https://bit.ly/3hWOLVT