Published On Apr 6, 2020
In this video we look at how to read Japanese candlestick charts. You can easily learn the kind of signals a candlestick chart provides. We give you the main patterns to help you spot the trends within the markets.
What are Japanese Candelsticks:
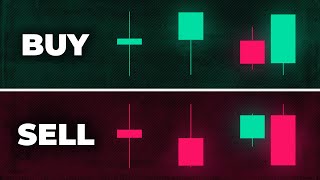
A candlestick chart (also called Japanese candlestick chart) is a style of financial chart used to describe price movements of a security, derivative, or currency. Each "candlestick" typically shows one day, thus a one-month chart may show the 20 trading days as 20 candlesticks.[1] Candlestick charts can also be built using intervals shorter or longer than one day.
It is similar to a bar chart in that each candlestick represents all four important pieces of information for that day: open and close in the thick body; high and low in the "candle wick". Being densely packed with information, it tends to represent trading patterns over short periods of time, often a few days or a few trading sessions.
Candlestick charts are most often used in technical analysis of equity and currency price patterns
#japanesecandlestick #finance #trading #optionstrading #money #stockmarketforbeginners #stockmarket #shorts #forex #technicalanalysis
Trading Strategies
Live Trade Coaching
Binary Options
CFD's
Futures
Equities
Commodities
FX