Published On Apr 4, 2022
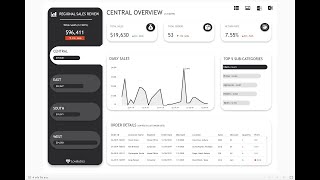
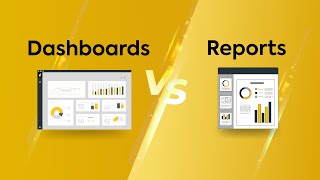
Dale shows us 12 tips to design better dashboards.
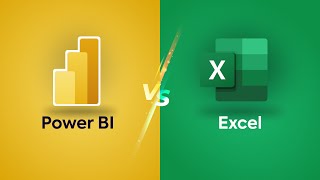
Whichever dashboard tool you are using, the lessons we cover in this video are applicable to all forms of dashboard design.
However, Geckoboard is easy to use and integrates with over 80 data sources. So if you want to try try Geckoboard for free, head over to Geckoboard using this link: https://buff.ly/3vG54Sy
12 Tips
00:00 Intro
00:55 #1: Know the purpose
01:24 #2: Include only the most important content
02:08 #3: Consider data ink ratio
03:09 #4: Round your numbers
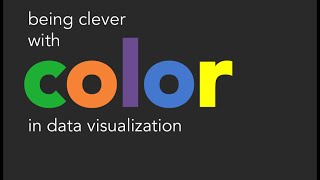
03:40 #5: Use the most efficient visualization
04:39 #6: Group related metrics
05:15 #7: Be consistent
05:50 #8: Show hierarchy
06:12 #9: Give numbers context
06:50 #10: Use clear labels
07:18 #11: Remember it's for people
08:18 #12: Keep evolving
Read our essential guide to dashboard design: https://www.geckoboard.com/best-pract...
#dashboards #dashboarddesign #datavisualization