Data Science with Yan
1.82K subscribers
28:31
Flights dataset| data manipulation | deal with date/week of the day | calendar heat map| R tidyverse
Data Science with Yan
50 views • 2 months ago
10:03
Split strings in R | change variables from characters to numeric | strisplit( )
Data Science with Yan
83 views • 7 months ago
9:08
Using R to draw US maps | regions | Selected States in the United States PART 1
Data Science with Yan
330 views • 10 months ago
9:45
One step boxplot considering two factors | customize your plot color palette
Data Science with Yan
21 views • 10 months ago
7:40
check for normal conditions | normality test | histogram | qq plot
Data Science with Yan
658 views • 1 year ago
6:15
Logarithmic regression| non-linear regression| lm in R| visualization of models
Data Science with Yan
3.1K views • 1 year ago
7:24
polynomial regression using R | non-linear regression | curved regression
Data Science with Yan
1.8K views • 1 year ago
10:18
The full process of one-way ANOVA | EDA | aggregate| model process| using R| RStudio
Data Science with Yan
166 views • 1 year ago
12:18
outliers and influential points| how to identify| understand them using data in R
Data Science with Yan
1K views • 1 year ago
3:24
working directory in R | check and change | export a R dataset to csv document
Data Science with Yan
215 views • 1 year ago
15:04
Leave one out and k-fold cross validation| using R| cv.glm | train and test data | prediction error
Data Science with Yan
9.2K views • 1 year ago
8:09
smoothing splines in R | degrees of freedom in smooth.spline | data predictions| data matches
Data Science with Yan
3.3K views • 1 year ago
14:05
data visualization| ggplot2| dplyr| data manipulation| Bar plot with error bars using R
Data Science with Yan
1K views • 1 year ago
7:07
creating dummy variables automatically using R | dummy_cols function|
Data Science with Yan
9.6K views • 2 years ago
8:19
How to plot any function curves in R | draw function curves using R | plot( ) | curve ( ) R function
Data Science with Yan
10K views • 2 years ago
8:33
What is cross validation? Why we need it? Leave one out and k-fold cross validation
Data Science with Yan
5K views • 2 years ago
10:52
what is poisson regression | what are really GLM?| using R | fit the model | real data examples
Data Science with Yan
1.1K views • 2 years ago
23:21
logistic regression using R | when to use | fit | interpret coefficients| odds | chi-square test
Data Science with Yan
4.9K views • 2 years ago
12:07
Hypothesis tests on Multiple linear regression using R | T-test| partial F-test| model comparison
Data Science with Yan
4.5K views • 2 years ago
25:24
Multiple linear regression model using R | lm( ) | variations of MLR | visualize results coefplot( )
Data Science with Yan
2.3K views • 2 years ago
6:21
boxplot for comparison | before and after| group cross group comparison| ggplot2| R
Data Science with Yan
3.5K views • 2 years ago
15:22
Modeling using R | simple linear regression| correlations, visualizations, fit a model lm() function
Data Science with Yan
916 views • 2 years ago
24:02
Create dates and times in R lubridate package| make_datetime( ) function | ymd( ) in RStudio
Data Science with Yan
2.7K views • 2 years ago
17:53
combine different datasets into one | relational data | R for data science | left_join function in R
Data Science with Yan
715 views • 2 years ago
20:28
Tidy messy data | R for data science | tidyr tidyverse package
Data Science with Yan
1K views • 2 years ago
11:32
tibbles and data frames in R | R for data science| book club| How to create tibbles and subset it
Data Science with Yan
3.2K views • 2 years ago
24:27
EDA part 2| ultimate guide to visualize covariations on two variables | R for data science book club
Data Science with Yan
343 views • 2 years ago
18:23
EDA exploratory data analysis part 1 distributions of one variable | R for data science book club
Data Science with Yan
455 views • 2 years ago
5:56
A guide to help you organize your R scripts | how to find your old code file quickly
Data Science with Yan
1.2K views • 2 years ago
23:31
Atomic Habits: Get better each day | R for loops, data manipulation, data visualization all in one
Data Science with Yan
173 views • 2 years ago
Load More

 28:31
28:31 10:03
10:03 9:08
9:08 9:45
9:45 7:40
7:40 6:15
6:15 7:24
7:24 10:18
10:18 12:18
12:18 3:24
3:24 15:04
15:04 8:09
8:09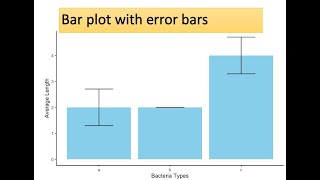 14:05
14:05 7:07
7:07 8:19
8:19 8:33
8:33 10:52
10:52 23:21
23:21 12:07
12:07 25:24
25:24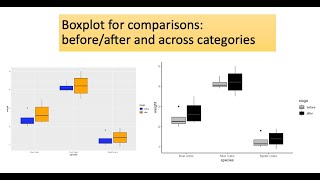 6:21
6:21 15:22
15:22 24:02
24:02 17:53
17:53 20:28
20:28 11:32
11:32 24:27
24:27 18:23
18:23
