Published On Jun 23, 2017
Join 400,000+ professionals in our courses here 👉 https://link.xelplus.com/yt-d-all-cou...
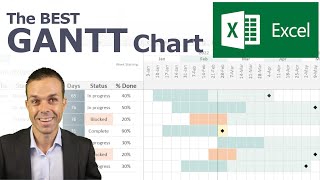
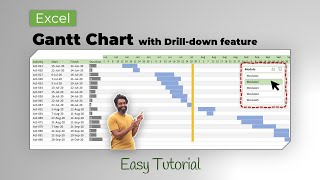
In this video, learn how to create a more complete Gantt chart that not only shows percentage completed for each task and conditionally formats the progress bars but also allows you to compare actual project plan to planned project plan.
Features include: automatic Gantt chart bars, automatic counting number of working days, automatic percent complete on Gantt bars, colored bars to indicate complete tasks and percentage completed.
⬇️ Download the free Excel Gantt chart template and edit to your own needs: https://pages.xelplus.com/gantt-chart...
Ideal for project management, this guide shows you how to build a dynamic Gantt chart that not only tracks task completion percentages but also adapts to changes in project timelines.
🔑 Key Points:
- Advanced Gantt Chart Features: Learn to create a Gantt chart that goes beyond basic functionalities, including conditional formatting for task completion and the ability to compare planned vs. actual timelines.
- Percentage Completion Tracking: Discover how to visually represent task progress with conditionally formatted bars, showing the extent of completion for each task.
- Flexibility for Project Changes: Understand how to modify the Gantt chart to reflect changes in task durations, start dates, and overall project planning.
- Utilizing Excel Charts and Functions: Gain insights into using stacked bar charts and arrow bars in Excel to represent tasks and their completion status effectively.
- Interactive Scenario Selection: Implement data validation to switch views between planned and actual project timelines seamlessly.
- Dynamic Axes and Labels: Learn how to make chart axes and labels dynamic, reflecting changes in the project plan directly on the Gantt chart.
Project Management Tool in Excel: This video is perfect for project managers, team leaders, and anyone looking to visually track project progress in Excel.
If you want to make a quicker Gantt chart to visualize your project before you start, check out this video: • How to Quickly Make a Gantt Chart in ...
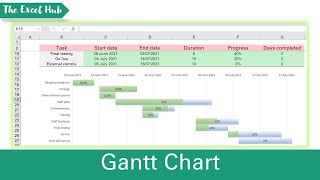
Gantt chart is a great visualization tool for project planning. Use the template to define the start date for each task as well as the number of working days each task will take. We will use Excel's Work day function to calculate the end date. This way we can account for weekends and holidays. We do two version. One for budget and one for actual. This allows us to switch the view of our gantt chart between actual and budget.
★ My Online Excel Courses ► https://www.xelplus.com/courses/
➡️ Join this channel to get access to perks: / @leilagharani
👕☕ Get the Official XelPlus MERCH: https://xelplus.creator-spring.com/
🎓 Not sure which of my Excel courses fits best for you? Take the quiz: https://www.xelplus.com/course-quiz/
🎥 RESOURCES I recommend: https://www.xelplus.com/resources/
🚩Let’s connect on social:
Instagram: / lgharani
LinkedIn: / xelplus
Note: This description contains affiliate links, which means at no additional cost to you, we will receive a small commission if you make a purchase using the links. This helps support the channel and allows us to continue to make videos like this. Thank you for your support!
#excel