Published On Jul 29, 2020
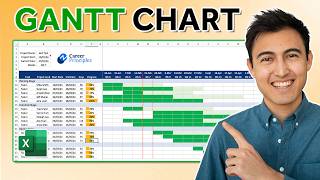
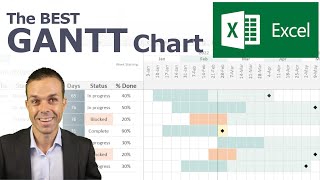
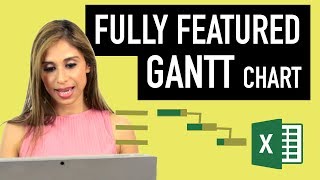
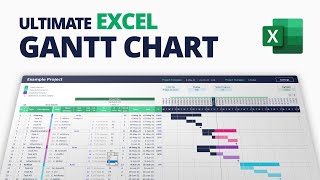
Learn how to create a multi-level Gantt chart / Project Plan using Microsoft Excel. You can use this to drill-down to an individual module or department activities and see the progress, completion and upcoming items.
For the gantt chart template and more visit:
https://chandoo.org/wp/drill-down-gan...
ABOUT THE GANTT CHART TEMPLATE
================================
We can use Excel's conditional formatting, slicers and tables to quickly create an automated, interactive project plan (or Gantt chart). In this video, I will show you how to make such a chart from raw project plan data such as module, activities, start date and finish date. We will create the chart that can be filtered by a module (or other things like team, deliverable milestone etc.).
We will be using slicers for the user interaction.
Whenever there is new data or change to project plan, you can refresh the pivot table (shortcut CTRL+ALT+F5) and the gantt chart will be automatically updated.
#GanttCharts #ProjectManagement #MsExcel