Published On Nov 29, 2020
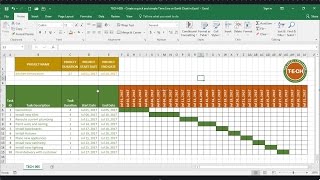
This video explains how you can easily create a graph to monitor the progress of multiple targets or tasks using Excel and then how to update and print this graph. Updating is the simplest thing, once you make more progress, simply change the number in progress column and Excel will take care of the rest. If you have any question, please message me. If you like this video, please do subscribe and share. Thank you very much.
show more