Published On Apr 15, 2021
This is a Google Data Studio Dashboard tutorial for beginners.
We describe the most important Data Studio functions for you to build great Google dashboards. Data Studio provides you with an opportunity to pull data from various sources (such as Google Sheets, Google Analytics, Google Ads, BigQuery, MySQL, Youtube Analytics and many others). You can then easily build tables, charts, and apply various filters to modify your reports. We review the whole flow from the basic account setup to building various Data Studio charts and dashboards.
What is Google Data Studio ?
Data Studio is a free tool that turns your data into informative, easy to read, easy to share, and fully customizable dashboards and reports. Use the drag and drop report editor to:
• Tell your data story with charts, including line, bar, and pie charts, geo maps, area and bubble graphs, paginated data tables, pivot tables, and more.
• Make your reports interactive with viewer filters and date range controls. The data control turns any report into a flexible template report that anyone can use to see their own data.
• Include links and clickable images to create product catalogs, video libraries, and other hyperlinked content.
• Annotate and brand your reports with text and images.
• Apply styles and color themes that make your data stories works of data visualization art.
Share and collaborate
It's easy to share your insights with individuals, teams, or the world. Invite others to view or edit your reports, or send them links in scheduled emails. To tell your data stories as broadly as possible, you can embed your reports in other pages, such as Google Sites, blog posts, marketing articles, and annual reports.
When you share a Data Studio file with another editor, you can work it together in real time as a team.
Use these timestamps to move right to a specific topic:
0:00 - Intro
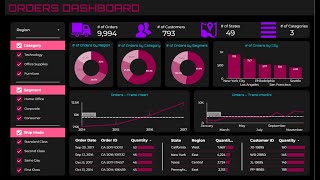
0:10 - Dashboard Introduction
0:25 - Bonuses For All Viewers
0:49 - Step-1 Source Data in excel
1:24 - Step-2 Load Data in Google Sheet
3:09 - Step-3 Connect The Data in Google Data Studio
5:47 - Step 4 Create Report
6:30 - Name Design Of Your Dashboard
7:25 - Table with bars
11:01 - Pie Chart
13:08 - Donut Chart
14:45 - Bar Chart
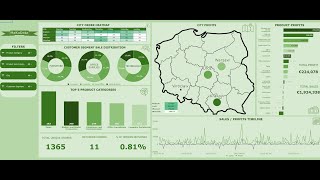
16:14 - Bubble Map (Google Map)
18:36 - Gauge
20:56 - Treemap Chart
22:01 - Scorecards
24:05 - Pivot Table
24:36 - Drop down list
25:40 - Slider
26:24 - Other Features
27:00 - Style & Background Colour
28:30 - Theme & Layout
29:30 - Final Dashboard
33:30 - Sharing Dashboard
35:17 - How To Download Bonuses
36:35 - Outro
Google Sheet : https://www.google.com/sheets/about/
Google Data Studio : https://datastudio.google.com/u/0/
Google Data Studio Dashboard By Vaibhav Vaidya :- https://datastudio.google.com/s/syvGG...
Get your personal copy of the HR Dashboard practice sheet: :- https://drive.google.com/file/d/1DHPm...
Bonuses(14000 PPT+10,000 Icon Set+ 150 Complete PPT) :- https://drive.google.com/drive/folder...
Hope You Like My Video And Share It. You Can Also Connect With Me From Other Social Sites...
Facebook ID:-- / vvaidya17
Twitter ID:- / vvaidya002
Instagram ID:- / vvaidya17
LinkedIn ID:- / vvaidya002
#Dashboard #GoogleDataStudio #BubbleMap